📊 Turn Data Into Clear, Powerful Business Presentations
The Bar Chart Presentation Template is a professional presentation design built to help startups, agencies, consultants, and business teams present data, performance, and insights clearly and convincingly.
Designed with non-repetitive layouts, this template makes it easy to showcase comparisons, growth metrics, reports, and strategic insights without overwhelming your audience. Simply open the file in PowerPoint, Google Slides, or Keynote and create a polished, client-ready presentation in minutes.
Perfect for pitch decks, marketing kits, business reports, digital media kits, and internal meetings.
🔹 What’s Included
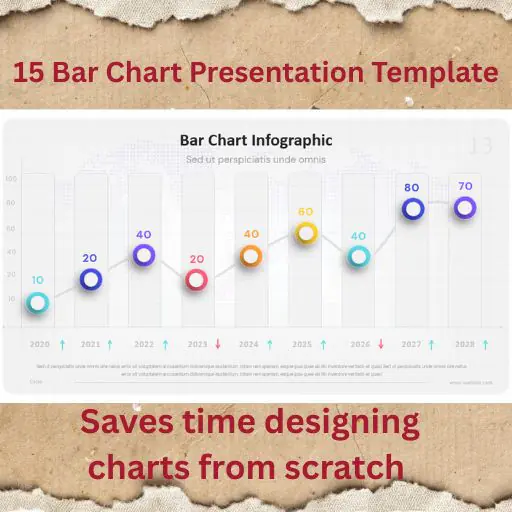
16 unique bar-chart focused presentation slides
Clean, modern, multi-purpose design
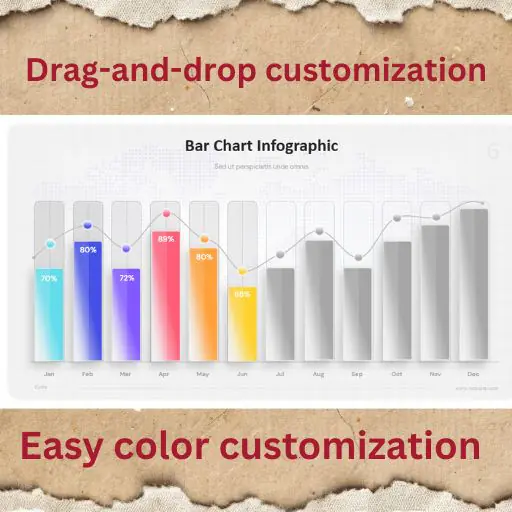
Fully editable charts and text
Image placeholders with drag-and-drop support
Based on master slides for fast editing
Predefined text styles for consistency
Vector-based icons
Unique portfolio and special slides
Easy color customization
Full HD slide resolution
PDF documentation included
Free support
🔹 Perfect For
Business & startup pitch decks
Data-driven presentations
Marketing & sales reports
Performance and comparison slides
Consulting & client presentations
Digital media and company profile decks
🔹 File Formats Included
PowerPoint (PPTX & PPT)
Google Slides
Keynote
🔹 Why Business Buyers Choose This Template
✔ Presents data clearly and professionally
✔ Saves time designing charts from scratch
✔ Suitable for client and investor presentations
✔ Clean typography focused on readability
✔ Works across all major presentation tools
💡 Use Case Example
Use this bar chart template to visually compare sales performance, growth metrics, KPIs, timelines, or market data in meetings or investor presentations without clutter.

This item was featured on What Digit
Published:
Dec 14, 2025 09:16 AM
Category:
Tags: