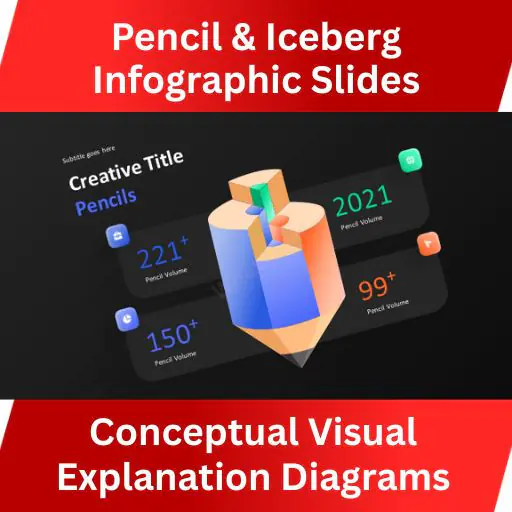


Pencil & Iceberg Infographics | Conceptual Diagrams (PowerPoint & Keynote, Light & Dark)
This product is built for explaining ideas beneath the surface.
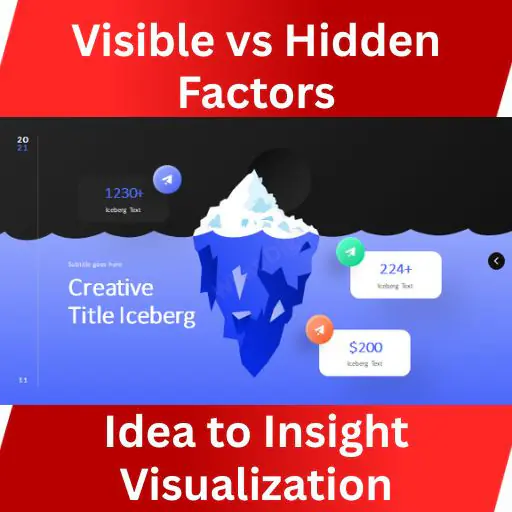
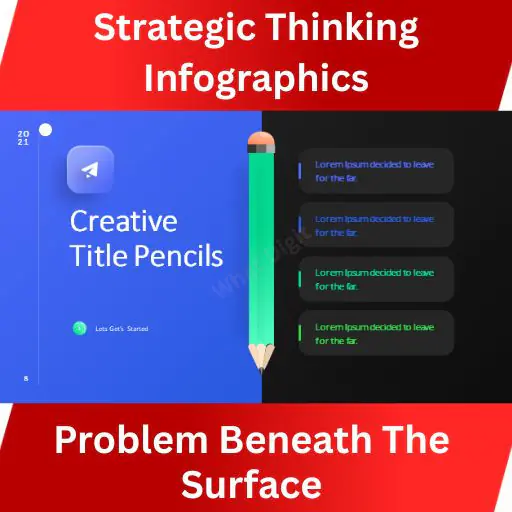
14 Pencil & Iceberg Infographics is a concept-driven infographic presentation pack designed to communicate thinking, insight, causes vs reality, visible vs hidden factors, and layered understanding—cleanly and visually.
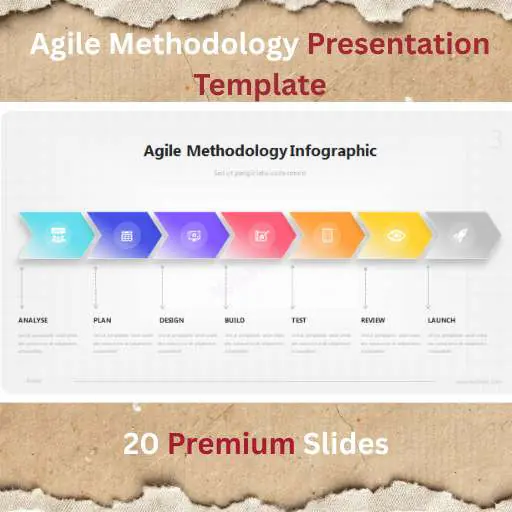
Pencil infographics help explain ideas, learning, planning, and creation.
Iceberg infographics help explain hidden problems, root causes, risks, and unseen effort.
If your presentation needs conceptual clarity, this pack does exactly that.
🎯 Best For
Strategy & concept presentations
Business problem explanation
Training & education slides
Psychology, mindset & awareness decks
Consulting & analytical storytelling
Brand, product & idea presentations
🚀 Key Features
14 unique pencil & iceberg infographic slides
Light & Dark themes included
Clean, minimal, concept-first design
Strong visual hierarchy for explanation
Fully editable shapes & text
Vector-based graphics (no quality loss)
Easy global color change
Master slide–based structure
Presentation-ready layouts
Full HD resolution
🧠 Infographic Types Included
Pencil concept diagrams (ideas, growth, learning)
Iceberg model diagrams (visible vs hidden factors)
Cause vs effect conceptual layouts
Insight & awareness slides
Explanation-focused visual storytelling
Each slide is designed to force understanding, not decoration.
📦 Files Included
PowerPoint .PPTX
PowerPoint .PPT
Keynote file
Documentation file
✔ Works on PowerPoint (Windows & Mac)
✔ Works on Keynote
✔ Google Slides supported via import
👥 Who Should Use This
Consultants & strategists
Trainers & educators
Founders & leadership teams
Analysts & planners
Anyone explaining complex ideas simply
If you explain why things look simple but aren’t, this pack is perfect.
📌 Important Notes
Preview images are for demonstration only
No stock images included
No plugins required
All elements are fully editable
Built for clarity & conceptual thinking
📈 Mini Case Study (Practical Use)
A consulting team used the Iceberg slides to explain operational failures:
Helped stakeholders see hidden root causes
Reduced blame-focused discussions
Shifted meetings toward solution thinking
That’s the power of the right visual metaphor.
Published:
Feb 04, 2026 04:15 PM
Category:
Tags: