
Metrics & KPI Dashboard PowerPoint Template | Animated & Static Performance Slides
This is a focused KPI dashboard pack, built for teams that don’t need 100+ slides—but still need clarity, speed, and professionalism.
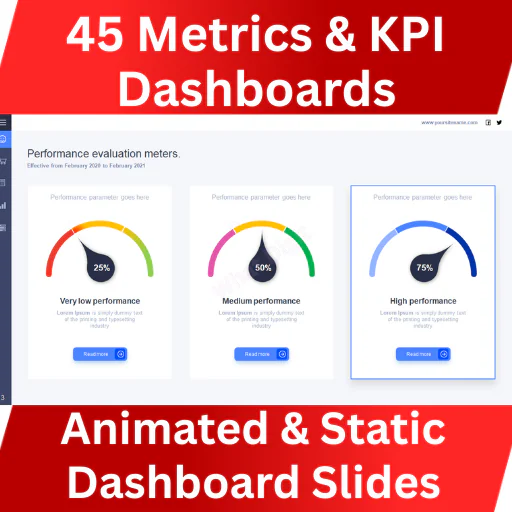
The 45 Metrics & KPI Dashboard PowerPoint Template delivers high-impact dashboards in both animated and non-animated versions, so you can present live or export clean reports without redesigning anything.
Every slide is structured for quick understanding, clean reporting, and executive-level communication.
No clutter.
No over-designed charts.
Just metrics that make sense.
🎯 Best For
Weekly & monthly business reports
Management & leadership reviews
Sales, marketing & operations tracking
Startup & SMB performance dashboards
Client reporting & agency decks
🚀 Key Features
45 professionally designed KPI dashboard slides
Animated + non-animated versions included
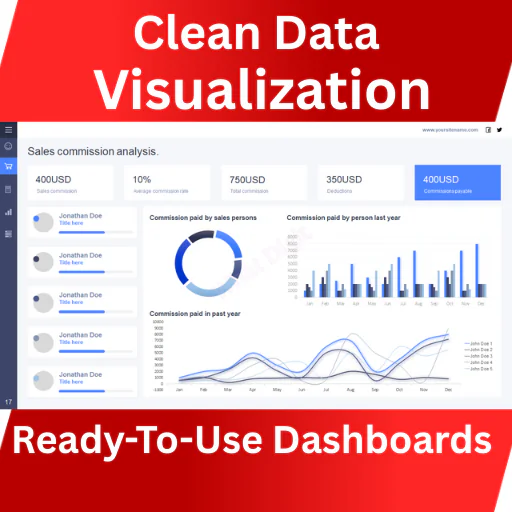
Clean, data-first dashboard layouts
Fully editable charts, graphs & text
High readability for meetings & screens
Consistent design system across slides
Vector-based charts & UI elements
Master slide–based structure
Easy color & metric customization
Full HD resolution
📊 Dashboard Types Included
Executive summary dashboards
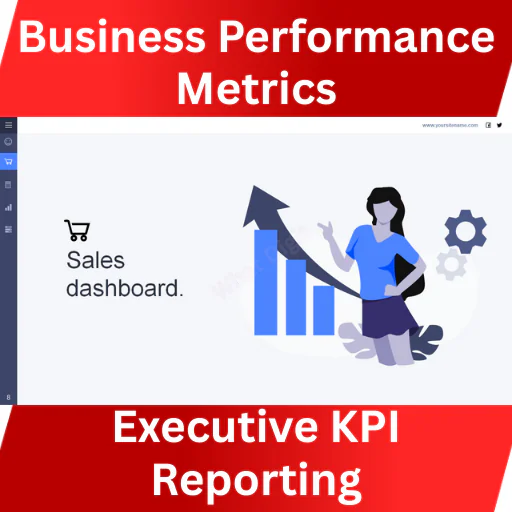
Sales & revenue metrics
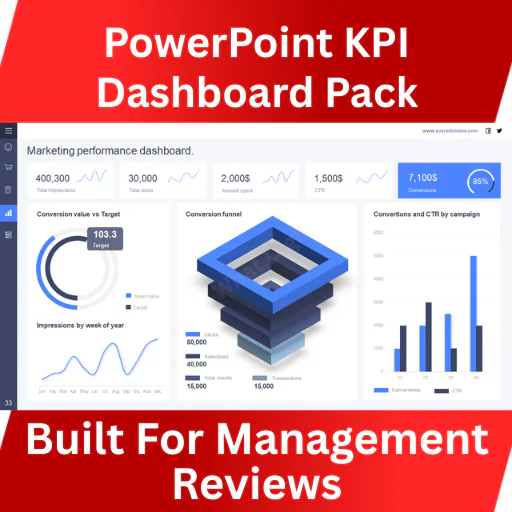
Marketing performance KPIs
Operations & productivity dashboards
Growth & performance tracking slides
Covers core business KPI needs without overload.
📦 Files Included
PowerPoint .PPTX
PowerPoint .PPT
Documentation file
✔ Works on Microsoft PowerPoint (Windows & Mac)
❌ Keynote & Google Slides via import only (animations may vary)
👥 Who Should Use This
Founders & managers
Department heads
Analysts & consultants
Agencies preparing client reports
Teams that want clean KPI visuals fast
If you track performance but hate rebuilding dashboards—this is for you.
📌 Important Notes
Preview images are for demo purposes only
No stock photos included
No plugins or add-ons required
Charts are fully editable inside PowerPoint
Animated and static versions are clearly separated
📈 Mini Case Study (Practical Use)
A sales team used this pack for monthly reviews:
Cut report preparation time by 50%
Improved leadership alignment on KPIs
Reduced slide redesign across departments
Good dashboards remove guesswork.
Published:
Feb 06, 2026 02:58 PM
Category:
Tags: