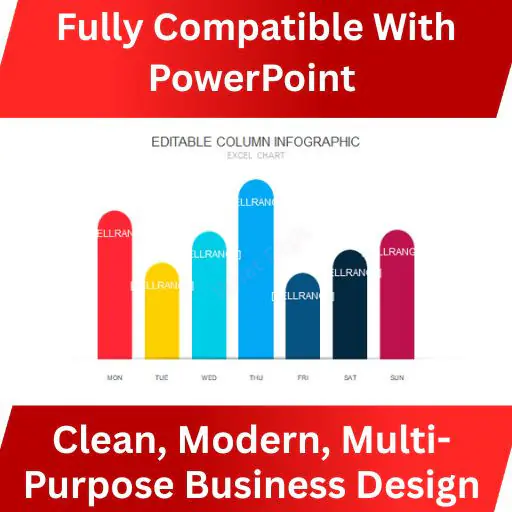
Animated Excel Data Chart Slides | PowerPoint Charts (Light & Dark Theme)
36 Animated Excel Data Chart Slides is a professionally designed PowerPoint-only chart system built for people who need to present numbers clearly, convincingly, and fast.
Every chart is designed to work directly with Excel-linked or manual data, with smooth animations that guide attention instead of distracting.
No clutter.
No gimmicks.
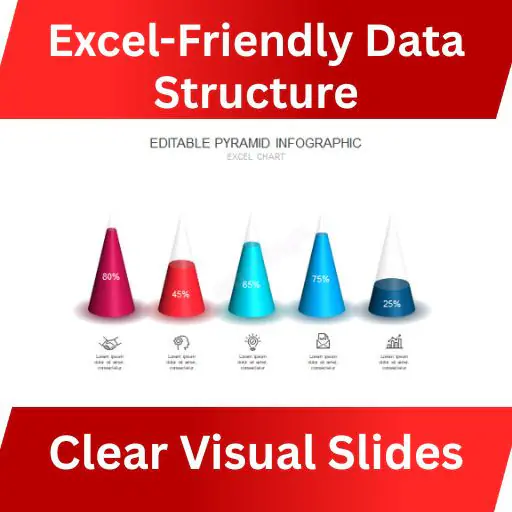
Just clean, readable, decision-ready charts in both light and dark themes.
🎯 Best For
- Business & corporate presentations
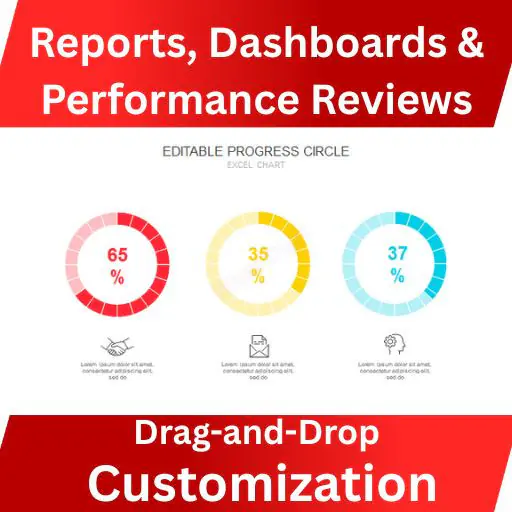
- Reports, dashboards & performance reviews
- Investor & stakeholder presentations
- Analysts, consultants & agencies
- Sales, marketing & operations teams
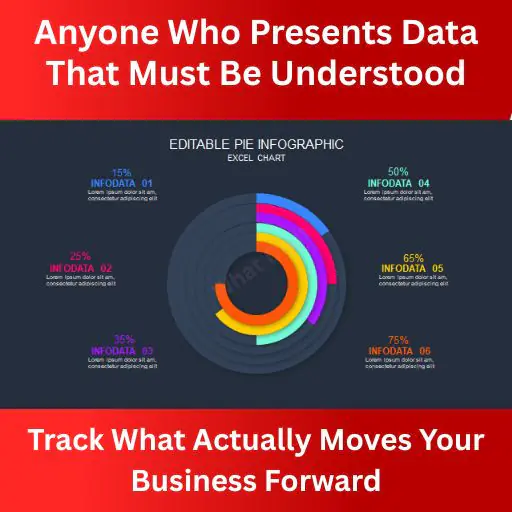
- Anyone who presents data that must be understood, not admired
🚀 Key Features
- 36 professionally animated data chart slides
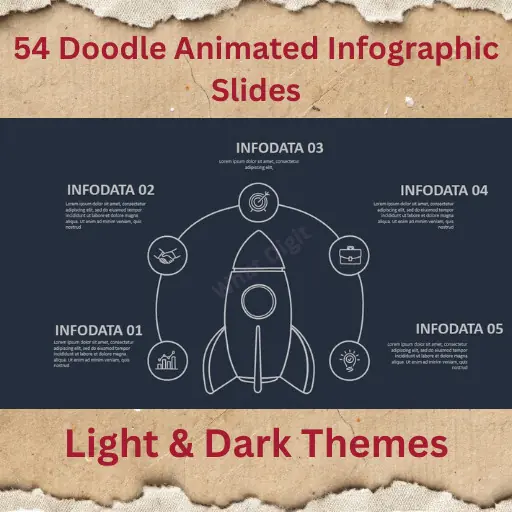
- Light & Dark theme included
- PowerPoint-only (optimized for performance)
- Excel-friendly data structure
- Smooth, clean animations for storytelling
- Fully editable charts & text
- Consistent typography & spacing
- High-contrast design for readability
- Presentation-ready layout (no redesign needed)
- Full HD resolution
- Zero learning curve — edit & present
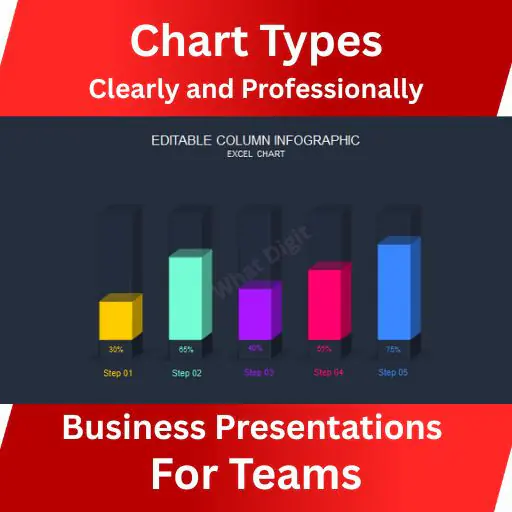
📊 Chart Types Included
- Bar charts
- Column charts
- Line charts
- Area charts
- Pie & donut charts
- Comparison charts
- Growth & trend charts
- Performance & KPI charts
(All charts are animation-ready and data-driven.)
📦 Files Included
PowerPoint .PPTX file
PowerPoint .PPT file
✔ Compatible with Microsoft PowerPoint (Windows & Mac)
❌ Not intended for Google Slides or Keynote
👥 Who Should Use This
- Founders presenting traction or metrics
- Managers explaining performance data
- Consultants delivering reports
- Agencies creating client decks
- Teams tired of rebuilding charts from scratch
- If your presentation includes numbers, this pack saves time and prevents confusion.
📌 Important Notes
PowerPoint file only (no Keynote / Google Slides)
- Preview images are for demonstration purposes only
- No external plugins required
- Charts are fully editable inside PowerPoint
- Works with Excel-based data inputs
📈 Mini Case Study (Practical Use)
A consulting team used this chart pack for quarterly performance reviews:
- Reduced slide preparation time by 70%
- Improved stakeholder understanding during live presentations
- Eliminated inconsistent chart styling across decks
That’s the real value: clarity + speed + consistency.