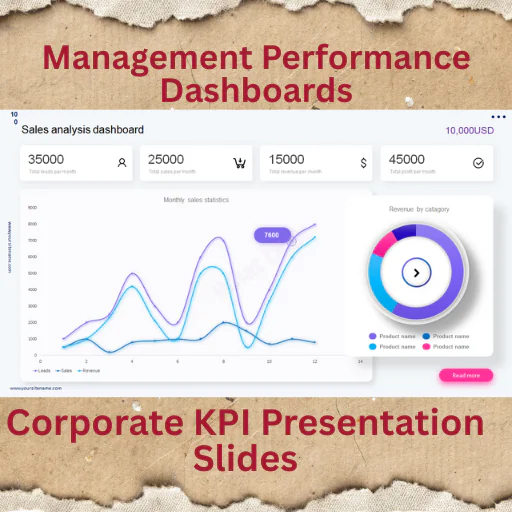


131 KPI Dashboard Slides | Animated & Static Performance Dashboards (PowerPoint)
This is a decision-making asset, not a design pack.
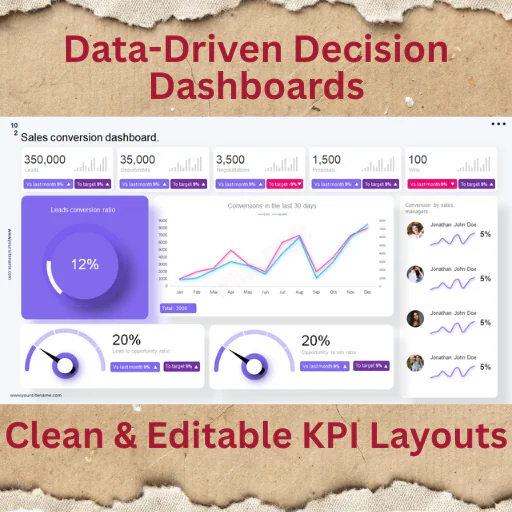
The 131 KPI Dashboard PowerPoint Presentation is a comprehensive dashboard system built to track, present, and explain performance metrics clearly—to managers, clients, investors, or stakeholders.
You get both animated and non-animated versions, so you can:
Use animations for live presentations
Use static dashboards for reports, exports, or reviews
No rebuilding dashboards.
No inconsistent charts.
Just ready-to-use KPI visuals.
🎯 Best For
Business performance reviews
Executive & management dashboards
Sales, marketing & operations reporting
Investor & board presentations
Monthly, quarterly & annual reports
Agencies & consultants
🚀 Key Features
131 professionally designed KPI dashboard slides
Animated + non-animated versions included
Clean, data-first dashboard layout
Fully editable charts, tables & metrics
High readability for large screens
Consistent visual system across dashboards
Vector-based charts & elements
Master slide–based structure
Easy color & metric customization
Full HD resolution
Built for clarity, not decoration
📊 Dashboard Types Included
Executive overview dashboards
Sales & revenue KPIs
Marketing performance dashboards
Operations & productivity KPIs
Financial & growth metrics
Team & project performance dashboards
Covers most real-world business KPI needs.
📦 Files Included
PowerPoint .PPTX
PowerPoint .PPT
Documentation file
✔ Works on Microsoft PowerPoint (Windows & Mac)
❌ Keynote & Google Slides via import only (animations may vary)
👥 Who Should Use This
Founders & leadership teams
Managers & department heads
Analysts & consultants
Agencies delivering reports
Anyone responsible for performance tracking
If you present metrics regularly, this becomes your default dashboard library.
📌 Important Notes
Preview images are for demonstration only
No stock photos included
No external plugins required
All charts are editable inside PowerPoint
Animated and static slides are clearly organized
📈 Mini Case Study (Practical Use)
A mid-size company replaced Excel screenshots with these dashboards:
Improved executive meeting clarity
Reduced reporting prep time by 60%
Created consistent KPI views across departments
Clear dashboards = faster decisions.
Published:
Feb 06, 2026 02:41 PM
Category:
Tags: