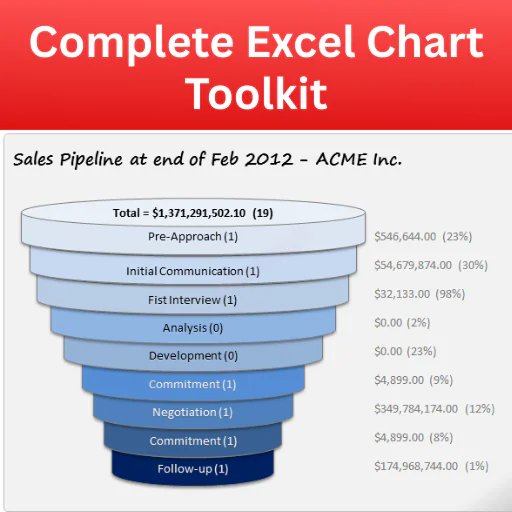
Complete Excel Charting & Performance Visualization Toolkit
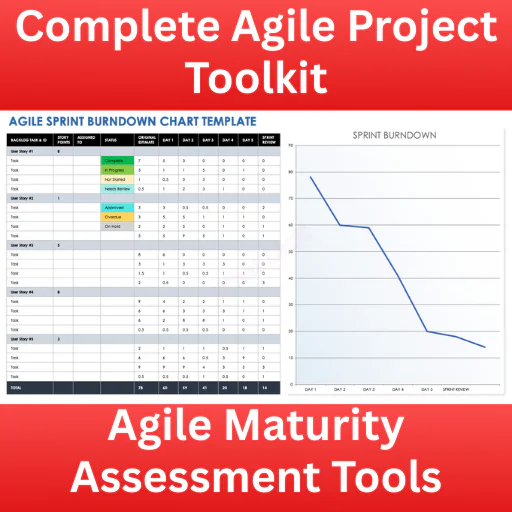
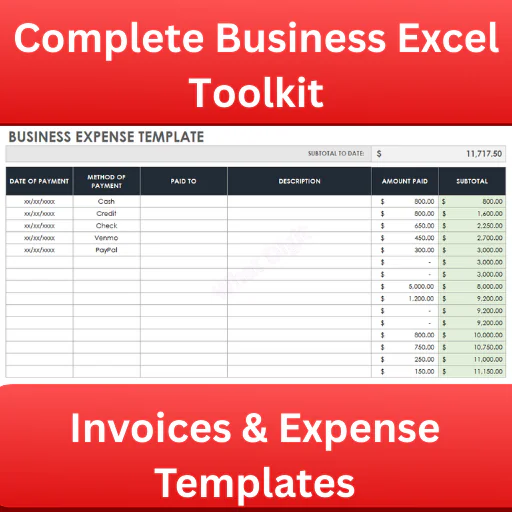
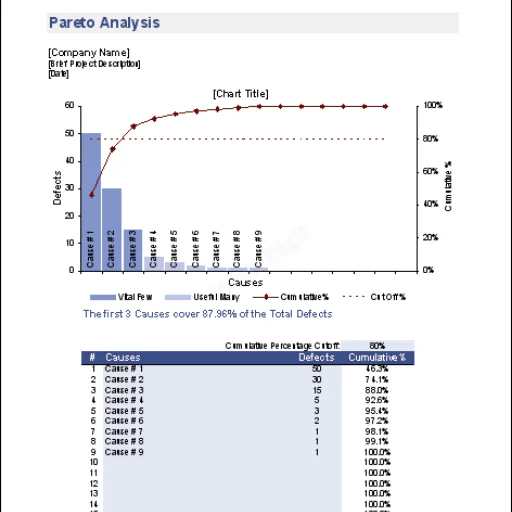
The Business Charts Excel Bundle is a practical spreadsheet pack designed to visualize projects, sales performance, manufacturing output, cost analysis, and operational metrics using structured Excel charts.
This is not decorative data.
It’s a decision-focused chart system built for tracking, comparison, and performance analysis.
If you rely on Excel for reporting, this saves serious setup time.
What’s Included
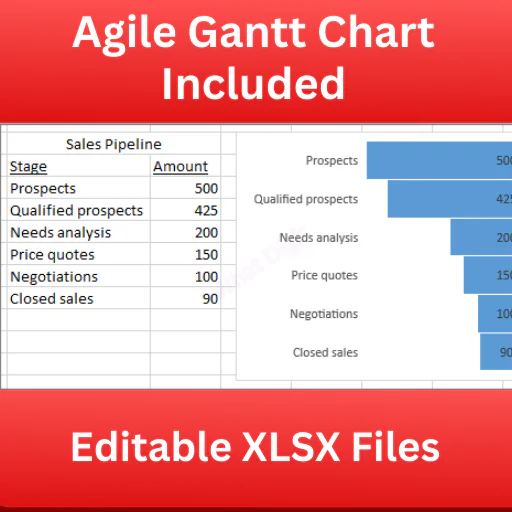
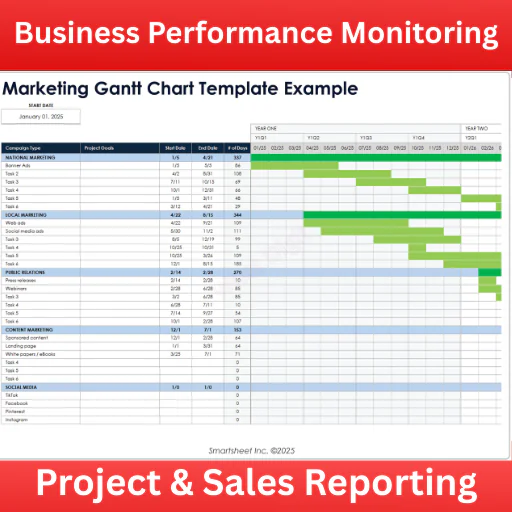
This bundle includes editable Excel chart templates such as:
Each file is delivered in editable .XLSX format.
Why This Chart Bundle Works
Most Excel users:
It eliminates repetitive setup work.
Key Features
Multiple Excel chart templates
Editable data input sections
Files Included
Multiple Excel (.XLSX) chart templates
✔ Fully editable
✔ Ready for business reporting
✔ Windows & Mac compatible
Best For
If you report data in Excel, this is practical infrastructure.
Important Notes
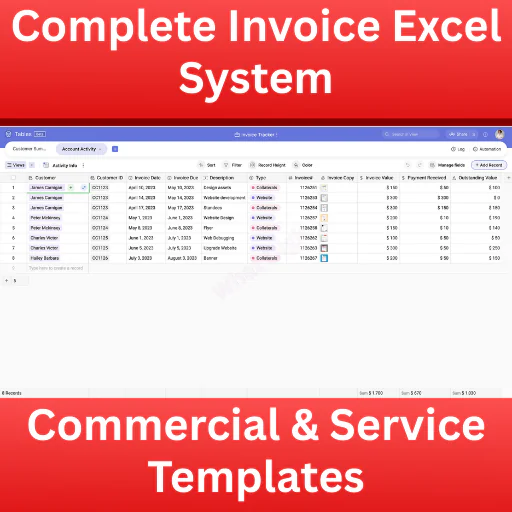
Case Example: Sales Performance Review
A regional sales team tracked performance in scattered spreadsheets.
Before:
After using this bundle:
Result: Faster performance review meetings and better decision-making.
Visual charts improve clarity and speed.
Published:
Feb 23, 2026 04:09 PM
Category:
Tags: