


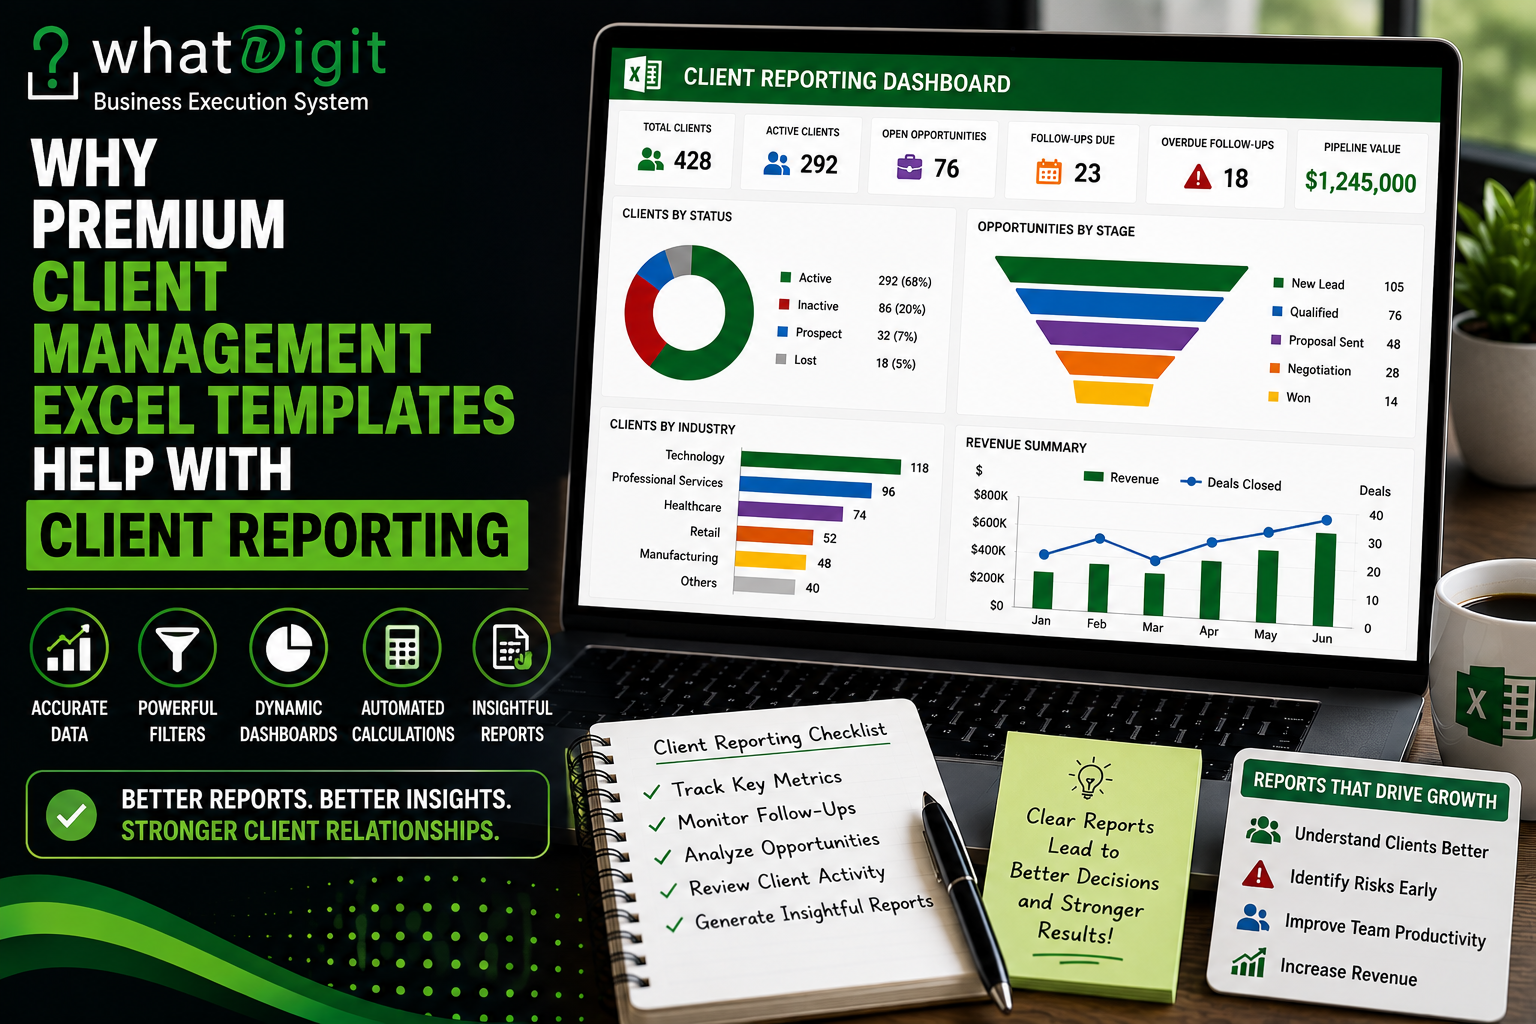
Client reporting becomes harder when customer information is spread across multiple worksheets, inconsistent records, and manually prepared summaries. A structured client management Excel template can bring client data, activities, follow-ups, sales information, and account details into a more organized reporting system. Premium templates may add dashboards, automated calculations, filters, visual summaries, and customizable reporting fields that reduce repetitive work. However, premium does not automatically mean better. The real value depends on whether the template produces accurate, useful reports that match the business's client-management workflow.
What Is Client Reporting?
Client reporting is the process of organizing and presenting information about customer relationships, activities, performance, opportunities, follow-ups, projects, and account status.
The purpose is not simply to create attractive spreadsheets.
A useful report should answer practical questions such as:
- How many active clients are currently being managed?
- Which accounts need follow-up?
- Which opportunities remain open?
- Which clients have recently been contacted?
- Which accounts are inactive?
- What activities have been completed?
- Which team members manage the most accounts?
- How are client categories distributed?
- Which accounts require management attention?
The exact information depends on the business.
A freelancer may need a simple client activity report, while a growing sales or service team may need account-level reporting combined with pipeline, follow-up, and performance information.
Why Basic Client Spreadsheets Can Make Reporting Difficult
A basic spreadsheet can successfully store client names, email addresses, phone numbers, and notes. The problem begins when users need to turn that information into recurring reports.
For example, imagine a business with several hundred client records. If employees manually review each row to determine which accounts are active, which follow-ups are overdue, and which opportunities remain open, reporting becomes time-consuming.
Inconsistent data entry creates another problem.
If one employee enters "Active," another enters "Current," and another uses "Active Client," a simple count may not treat those values consistently.
A professionally structured template can reduce these problems by providing standardized fields, controlled categories, filters, formulas, and reporting structures.
Structured Data Makes Reporting More Reliable
Reporting quality depends heavily on the quality of the underlying data.
A client management template can separate information into defined fields such as:
- Client Name
- Company
- Client Status
- Account Owner
- Industry
- Last Interaction
- Next Follow-Up
- Sales Stage
- Opportunity Value
- Customer Tier
Each field serves a specific purpose.
Instead of storing everything inside a single notes column, structured information can be sorted, filtered, summarized, and used by formulas.
That makes reporting more practical.
However, structure alone does not guarantee accuracy. Employees still need to enter and maintain information consistently.
Premium Templates Can Reduce Manual Reporting Work
One potential advantage of a premium template is the amount of reporting work that has already been structured.
A basic spreadsheet may require users to manually:
- Filter client records.
- Count different statuses.
- Calculate opportunity totals.
- Identify overdue follow-ups.
- Create charts.
- Prepare management summaries.
A more advanced workbook may perform some of these calculations automatically.
That can reduce repetitive spreadsheet work.
The important distinction is that automation should support the reporting workflow rather than create unnecessary complexity.
Dashboards Turn Client Data Into a Management View
Dashboards are one of the most visible differences between basic and advanced client management templates.
A dashboard can summarize important information through KPI cards, charts, tables, and visual indicators.
Potential metrics include:
- Total Clients
- Active Clients
- Inactive Clients
- Open Opportunities
- Follow-Ups Due
- Overdue Follow-Ups
- Pipeline Value
- Completed Activities
A manager can potentially understand the overall client portfolio without reviewing every individual record.
Still, dashboards should be evaluated carefully. A dashboard is only as reliable as the data and formulas behind it.
KPI Reporting Can Make Client Information Easier to Review
Key performance indicators can provide a quick numerical summary.
For example, a client dashboard might show:
Total Clients: 428
Active Clients: 292
Open Opportunities: 76
Overdue Follow-Ups: 18
These numbers can help a manager identify areas that deserve further review.
However, KPI numbers should not be treated as business conclusions by themselves.
For example, a high number of active clients does not necessarily indicate strong profitability. Similarly, a large pipeline does not guarantee future revenue.
The dashboard provides visibility. Management still needs context and judgment.
Client Reporting Can Combine Different Data Categories
A strong reporting structure can connect multiple client-management dimensions.
For example, a business could analyze:
Client Status + Customer Tier + Account Owner
This might show how many premium accounts each employee manages.
Another report could combine:
Industry + Sales Stage + Opportunity Value
This can help identify where open opportunities are concentrated.
A third view might combine:
Client Status + Last Interaction + Next Follow-Up
This can help identify accounts that require attention.
The ability to combine fields is one reason structured data is more useful than unorganized client notes.
Automated Formulas Can Improve Reporting Efficiency
Excel formulas can calculate information that would otherwise require repeated manual work.
Examples include:
- Total client counts
- Opportunity totals
- Expected revenue
- Days since last contact
- Days until follow-up
- Overdue activity
- Project completion
- Customer status summaries
For example, a formula can compare a follow-up date with the current date and identify whether the task is overdue.
This can make recurring reporting more efficient.
Nevertheless, formulas should be transparent and dependable. A workbook that contains complicated calculations without clear instructions can become difficult to maintain.
Filters Make Reports More Flexible
A static report may answer one question.
A filterable report can answer many.
For example, a manager could filter the client database by:
- Active clients
- Premium clients
- A particular account owner
- One industry
- Follow-ups due this week
- Open opportunities
- Inactive accounts
This means the same underlying database can support different reporting needs without creating a new spreadsheet for every request.
Filtering becomes especially useful when client records grow over time.
Sorting Helps Identify Priorities
Sorting is another simple but useful reporting capability.
A client list could be sorted by:
- Highest opportunity value
- Oldest last interaction
- Earliest follow-up date
- Customer tier
- Account owner
- Project deadline
- Client status
For example, sorting by next follow-up date can bring the most urgent activities to the top.
Similarly, sorting by opportunity value can help a sales manager review larger opportunities first.
These functions may appear basic, but they become much more useful when the underlying client database is consistently structured.
Client Activity Reporting Provides Context
Client reporting should not focus exclusively on sales numbers.
Activity information can reveal how actively accounts are being managed.
Useful activity fields include:
- Call
- Meeting
- Proposal
- Review
- Follow-Up
- Project Update
A report could summarize the number or type of activities associated with different accounts.
This may help managers identify clients with substantial recent engagement and accounts with little recorded activity.
Again, activity volume should not automatically be interpreted as relationship quality. A few meaningful interactions can be more valuable than many routine contacts.
Follow-Up Reporting Can Highlight Workload
Follow-up management is closely connected to client reporting.
A reporting dashboard might separate:
- Due Today
- Due This Week
- Upcoming
- Overdue
- Completed
This gives managers a clearer view of pending client-related work.
For example, a manager could see that one employee has several overdue follow-ups while another has a lighter workload.
That information can support workload discussions and prioritization.
The report does not replace the team's responsibility to manage follow-ups. It simply makes the workload more visible.
Client Segmentation Improves Report Relevance
Not every client needs to appear in every report.
Segmentation allows businesses to focus reports on meaningful groups.
Possible categories include:
- Industry
- Customer Tier
- Client Status
- Location
- Service Type
- Account Owner
- Revenue Category
- Sales Stage
A service business could create a report showing active clients by service type.
A sales team could report opportunities by industry.
An account management team could focus on strategic clients with upcoming follow-ups.
The reporting system becomes more useful when the segmentation reflects actual business decisions.
Visual Charts Make Patterns Easier to See
Tables provide detail.
Charts provide visual comparison.
Depending on the reporting requirement, useful charts may include:
- Pie charts
- Bar charts
- Line charts
- Funnel charts
- Column charts
For example, a bar chart could compare the number of clients by industry.
A funnel chart could summarize sales opportunities by stage.
A line chart could show client activity across several months.
Visual reporting can make changes and differences easier to identify, especially during management reviews.
However, charts should be used when they clarify information. Adding charts simply to make a workbook look sophisticated does not improve reporting.
Monthly Client Reports Can Support Management Reviews
A structured workbook can help create recurring monthly reports.
A monthly client review might include:
- New clients
- Active clients
- Inactive clients
- Follow-ups completed
- Overdue follow-ups
- New opportunities
- Closed opportunities
- Pipeline value
- Client activity
The exact metrics should reflect the business.
Monthly reporting can also make it easier to compare periods, provided the underlying data is collected consistently.
If the business changes its definitions halfway through the year, comparisons may become misleading.
Account Owner Reporting Can Improve Accountability
When each client is assigned to an account owner, reporting can become more specific.
For example, management could review:
Account Owner → Active Clients → Overdue Follow-Ups
This creates a clear operational view.
Another report might show:
Account Owner → Open Opportunities → Pipeline Value
Such reporting can help managers understand workload distribution and account responsibilities.
However, the numbers should be interpreted carefully. The number of accounts assigned to an employee does not necessarily reflect the difficulty or value of those accounts.
Client Reporting Can Support Service Businesses
Service businesses often need reporting that combines customers with ongoing work.
A service company may want to know:
- Which clients have active projects?
- Which projects are approaching deadlines?
- Which clients require approval?
- Which accounts have pending tasks?
- Which customers have upcoming renewals?
A client management Excel template can provide a centralized structure for this information when the workbook includes appropriate project and activity fields.
A basic contact list would not provide the same operational visibility.
Reporting for Sales Teams
Sales teams can use client-management reporting to monitor prospects and opportunities.
Potential report fields include:
- Lead Source
- Sales Stage
- Opportunity Value
- Probability
- Expected Close Date
- Account Owner
- Next Follow-Up
A dashboard could summarize opportunities by sales stage.
For example:
New Lead → Qualified → Proposal → Negotiation → Won
This gives management a high-level view of the pipeline.
However, sales forecasts should not be treated as guaranteed outcomes. Spreadsheet calculations are based on entered assumptions and should be reviewed against actual business conditions.
Reporting for Client Retention
Client reporting can also support retention efforts.
A business may monitor:
- Active accounts
- Inactive accounts
- Renewal dates
- Recent interactions
- Customer tier
- Engagement indicators
For example, a manager could review high-value clients whose contracts are approaching renewal.
That does not mean the spreadsheet can predict whether a customer will renew. Instead, it helps organize information that may deserve attention.
Premium Templates Can Improve Reporting Consistency
Consistency is one of the strongest practical benefits of a structured reporting system.
If every employee uses the same fields, categories, date formats, and status definitions, reports become easier to interpret.
For example, everyone might use:
Active
Inactive
Prospect
Lost
instead of creating their own variations.
Similarly, standardized date formats reduce confusion and make date-based calculations more dependable.
Consistency may not look like an advanced feature, but it is fundamental to useful reporting.
Customization Makes Reporting More Relevant
Every business has different reporting requirements.
A marketing agency might need campaign information.
A consulting firm may need engagement details.
An IT service provider may need service categories and project status.
An accounting firm may need deadlines and document tracking.
Therefore, customization can be an important factor when evaluating a premium template.
Useful customization options may include:
- Adding fields
- Changing categories
- Editing dropdowns
- Modifying dashboard metrics
- Creating new report views
- Adjusting status definitions
Customization should be performed carefully when formulas, charts, or dashboards depend on the original workbook structure.
Protecting Formulas Matters
Reporting templates often depend on formulas.
If users accidentally overwrite a calculation, the report may become incorrect without immediately appearing broken.
For that reason, a professionally structured workbook may distinguish between:
Input Cells
and
Calculated Cells
Some templates may also use protection or visual indicators to reduce accidental changes.
Users should understand which cells are intended for data entry and which contain formulas before customizing the workbook.
Documentation Can Improve Reporting Accuracy
Instructions are particularly useful when a workbook includes several worksheets, formulas, dropdowns, and dashboards.
Documentation can explain:
- Where to enter client data
- How to add new records
- How status categories work
- How reports update
- Which fields are required
- How to customize lists
- Which formulas should not be changed
Without clear instructions, employees may use the workbook differently.
That can undermine reporting consistency.
Free Templates Can Still Be Effective
A premium template is not automatically necessary.
A free client management spreadsheet may work perfectly well for a freelancer or small business with:
- A small client database
- Basic reporting requirements
- One primary user
- Limited segmentation
- Simple follow-ups
In such cases, paying for advanced dashboards or automation may not provide enough additional value.
The right choice depends on the complexity of the reporting workflow.
When a Premium Template May Be Worth the Cost
A paid template may provide greater value when reporting has become repetitive or difficult to maintain.
For example, a growing business may need to combine:
- Client management
- Sales pipeline tracking
- Follow-up management
- Activity records
- Customer segmentation
- Dashboards
- Performance reporting
If the template brings these elements into one coherent structure, it may reduce the need to build reporting systems from scratch.
For businesses considering whether to buy Client Management Excel Template online in USA, the focus should remain on practical functionality, workbook quality, customization, compatibility, and reporting requirements rather than price alone.
Reporting Quality Depends on Data Quality
No template can compensate for consistently poor data.
If employees fail to update client status, enter incorrect dates, duplicate records, or leave important fields blank, reports can become misleading.
Businesses should therefore establish basic data-maintenance practices.
These may include:
- Reviewing records regularly
- Standardizing categories
- Removing duplicates
- Updating account ownership
- Recording follow-ups promptly
- Checking formulas
- Reviewing inactive clients
- Maintaining consistent date formats
Reporting should be treated as the output of a data-management process.
Avoid Overcomplicated Reporting
More reports do not necessarily mean better management.
A dashboard containing 20 charts may overwhelm users when five meaningful metrics would be sufficient.
Similarly, creating separate reports for every possible client attribute can increase administrative effort.
Good reporting focuses on information that supports actual decisions.
Before adding a metric, ask:
What decision will this information help us make?
If there is no clear answer, the metric may not deserve space on the dashboard.
What Buyers Should Evaluate
Before purchasing a premium client management Excel template, examine the reporting system rather than focusing only on the design.
Check whether the workbook provides:
- Structured client data
- Consistent categories
- Filterable tables
- Automated formulas
- KPI summaries
- Dashboards
- Charts
- Follow-up reports
- Activity tracking
- Customizable fields
- Clear documentation
Also verify whether the reports update correctly when new client records are added.
A template that looks professional but requires extensive manual maintenance may provide less value than expected.
Check Scalability
Reporting requirements often increase as the client database grows.
A small business might initially need only a client-status report.
Later, it may require:
- Account-owner reporting
- Sales pipeline reporting
- Follow-up dashboards
- Industry segmentation
- Revenue analysis
- Activity trends
The workbook should be able to accommodate reasonable growth without requiring users to rebuild every report.
However, Excel has practical limitations. A spreadsheet may be appropriate for a manageable workflow but become less suitable when data volume, collaboration, automation, or system integration becomes highly complex.
Excel Compatibility Should Be Considered
Before purchasing a template, verify the Excel environment required by the workbook.
Some templates may depend on:
- Modern Excel formulas
- Microsoft 365 features
- Macros
- VBA
- Power Query
- Power Pivot
A workbook that relies on unavailable functionality may not operate correctly.
Compatibility should therefore be evaluated before purchase, particularly when a template uses automation or advanced reporting features.
A Practical Reporting Example
Consider a hypothetical service business with 200 clients.
The company wants to review its client portfolio every Monday.
A structured template could provide a dashboard showing:
Total Clients: 200
Active Clients: 152
Inactive Clients: 28
Open Opportunities: 20
Follow-Ups Due: 14
The manager could then filter the client database by account owner, customer tier, or status.
Next, the manager could review overdue follow-ups and open opportunities.
The template does not make management decisions automatically. Instead, it reduces the effort required to locate and organize the relevant information.
That is the practical role of spreadsheet reporting.
The Difference Between Reporting and Decision-Making
This distinction is important.
A report tells you what the data currently shows.
A decision determines what should happen next.
For example, a report may show that several high-value clients have not been contacted recently.
Management must then decide whether those accounts require immediate outreach, whether the lack of contact is expected, or whether the client records need updating.
A premium template can improve visibility.
It cannot replace business judgment.
Common Reporting Mistakes
Several mistakes can reduce the value of a client reporting workbook.
Tracking Too Many Metrics
Excessive metrics make important information harder to identify.
Using Inconsistent Categories
Different labels can distort counts and charts.
Ignoring Historical Data
Deleting inactive clients may remove useful relationship context.
Changing Formulas Carelessly
Overwriting calculated cells can damage reports.
Relying Entirely on Dashboards
Visual summaries still require underlying data validation.
Failing to Define Metrics
Employees may interpret terms such as "active client" differently.
Never Reviewing the Reporting Structure
Business needs change. Reports should be reviewed periodically to ensure they still answer relevant questions.
Who Benefits Most From Advanced Client Reporting?
Advanced reporting can be particularly useful for:
Sales Teams
Sales managers can review pipelines, opportunities, follow-ups, and account ownership.
Service Businesses
Service teams can connect client accounts with projects, tasks, deadlines, and communication.
Consultants
Consultants can monitor engagements, clients, activities, and upcoming work.
Agencies
Agencies can combine client accounts with campaigns, projects, deadlines, and account responsibilities.
Growing Small Businesses
Small companies may use structured Excel reporting before deciding whether they require a dedicated CRM or broader business-management system.
Final Evaluation: Is Premium Reporting Worth It?
The answer depends on the reporting problems the business is trying to solve.
A premium template may be worthwhile when it provides:
- Better data organization
- Automated calculations
- Useful dashboards
- Flexible filtering
- Customizable reports
- Consistent categories
- Clear documentation
- Scalable structure
It may not be worthwhile when the business only needs a simple client list and occasional manual reporting.
The objective should never be to buy the most sophisticated workbook available.
The objective is to choose a system that delivers enough functionality to make client reporting more organized, accurate, and practical without introducing unnecessary complexity.
Conclusion
Premium client management Excel templates can add value to client reporting by combining structured data, automated calculations, dashboards, filters, visualizations, and customizable reporting fields. These features can reduce repetitive reporting work and make important client information easier to review.
However, the template itself is only part of the solution. Accurate data entry, consistent definitions, regular maintenance, appropriate customization, and sensible reporting practices remain essential. The strongest choice is therefore not simply the most expensive template. It is the one whose reporting capabilities match the business's actual client-management needs.
Frequently Asked Questions
Are premium client management Excel templates better for reporting?
They can be, particularly when they include structured data fields, automated formulas, dashboards, filters, and customizable reports. However, premium pricing does not guarantee quality. A simpler template may be more suitable for a small business with limited reporting needs. Evaluate functionality, usability, compatibility, and maintenance requirements before purchasing.
What should a client management Excel report include?
Useful reports can include client status, account owner, last interaction, next follow-up, sales stage, opportunity value, customer tier, activity, and project information. The appropriate fields depend on the business. A good report should focus on information that supports real management decisions rather than attempting to display every available data point.
Can Excel dashboards automatically update client reports?
Some templates can automatically update dashboards when underlying data changes, provided the workbook has been designed correctly. Features vary considerably between templates. Buyers should check whether new records are included automatically, whether formulas and charts update dynamically, and whether any manual refresh or maintenance steps are required.
Is a paid client management template worth the price?
It can be worthwhile when it saves meaningful setup and maintenance work or provides reporting functionality that would otherwise require significant spreadsheet development. However, businesses should compare the actual features against their needs. Paying for dashboards or automation that the team will never use is not good value.
Can I customize reports in a premium Excel template?
Many templates allow some customization, including changing categories, adding fields, adjusting dropdowns, or modifying dashboard elements. The level of flexibility varies. Before making changes, determine whether formulas, charts, or reports depend on the original structure. Improper customization can cause calculation or reporting problems.
How does automation help with client reporting?
Automation can calculate recurring metrics such as client counts, opportunity totals, expected revenue, days since contact, and overdue follow-ups. This reduces repetitive manual calculations. However, automated reporting remains dependent on accurate source data and correctly configured formulas. Automation should simplify a useful workflow rather than add unnecessary complexity.
Can a client management Excel template replace a CRM?
For some small or straightforward workflows, an Excel template may provide sufficient organization and reporting. However, dedicated CRM platforms can offer capabilities such as advanced collaboration, permissions, integrations, automation, and centralized communication histories. The appropriate choice depends on the business's scale, workflow complexity, and reporting requirements.
What makes a client report reliable?
Reliable reporting requires consistent data definitions, accurate records, standardized categories, maintained formulas, and regular updates. Users should understand what terms such as "active client," "inactive client," or "open opportunity" mean. A visually impressive dashboard cannot compensate for inconsistent or outdated source information.
Should inactive clients be included in client reports?
That depends on the purpose of the report. An operational dashboard may focus primarily on active accounts, while a retention or historical report may need inactive clients as well. Keeping inactive records in the database can preserve useful relationship history without requiring them to appear in every active-client report.
What should I check before purchasing a client reporting Excel template?
Check the workbook's data structure, dashboard functionality, formulas, filters, customization options, documentation, scalability, and Excel compatibility. Also verify how new records affect reports and whether calculated fields are protected appropriately. Most importantly, compare the template's actual reporting capabilities with the business's workflow instead of judging value from appearance alone.
Comments (0)